Pollution Control by Use of Bioindicators / Biomonitors
Examples for Biomonitoring
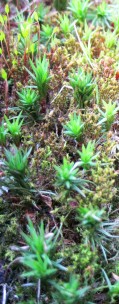
Mosses for atmospheric pollution measurements
In addition to instrumental measuring techniques the use of mosses have long been an accepted method of monitoring human-induced atmospheric inputs of heavy metals and other elements into the environment (Rühling & Tyler 1968; Smodis 2003; Herpin et al. 2004).
Mosses represent one of the simplest forms of terrestrial plants. This is directly connected with the peculiarities of their water metabolism. The dominant phase of the bryophyte life cycle is represented by gametophyte generation. Consequently, evolution of structural complexity has been partly limited by the dependence of sexual reproduction on free water for the dispersal of the motile antherozoids.
For some ten years now, epiphytic or epigeic plants – mostly mosses and lichens, but also Bromeliaceae (Tillandsia) in Latin America – are being employed as bioindicators, their use being accepted not only in the scientific community but also among political or economic authorities in both Europe and Southern America (Bargagli 1998; Freitas et al. 2000; Pignata et al. 2002; Zechmeister et al. 2003; Markert et al. 2004). This state of matters differs from those in other countries and continents (China, Australia- North America) where plant-based biomonitoring was developed for scientific purposes or on regional rather than national scales (only). Thus no comprehensive description may be given but one has to consider unlike developments of these techniques (Zechmeister 1995; Djingova & Kuleff 2000; Garty 2000a, 2000b; Herpin et al. 2001; Wolterbeek 2002; Djingova et al. 2003, Fränzle O 2003).
This high diversity in developments of bioindication and biomonitoring was not produced arbitrarily but owes to fundamental (and thus acceptable!) reasons (Markert et al. 2008):
- historical ones, with corresponding methods spreading from Scandinavia via Europe to the rest of the world;
- geographical, climatic and geogenic distinctions which influence each living organism and population (hard skills);
- different mental and psychological attitudes depending on intercultural attitudes among scientists of different origins who encounter each other e.g. in international meetings for harmonization and procedures (soft skills).
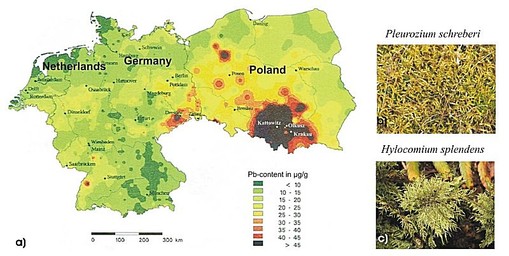
Results from chemical analysis are converted into multi-color maps (s. figure) of pollution using geographic information systems (GIS), providing maps such as that for lead (moss samples were taken from 1990-1992).
Figure: (a) This map gives Pb contents in moss species from different countries (Netherlands, Germany, Poland), using moss samples taken during 1990-1992 (Herpin et al. 1996). (b, c) Mosses [only two moss species of a total of four of the overall European program are shown as examples: Pleurozium schreberi (b) and Hylocomium splendens (c)] are bioindicators / biomonitors for controlling the atmospheric deposition of different chemical elements.
As final output of such investigations bioindication results compare relative (analytical) data of (element) concentrations given by bioindicator species (mosses). In this example the mosses are represented by different locations around Middle Europe. Same can be done by using bioindicator to get an impression on behavoiur of chemicals by time. As example is given for Pb in mosses (Polytrichum formosum) collected over some years.
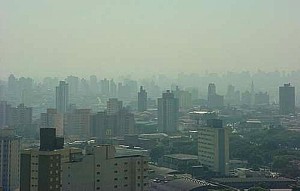
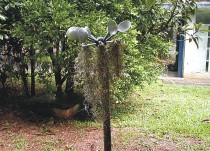
Spanish Moss for atmospheric pollution measurements f.e. in megacities like São Paulo, Brazil (Markert et al. 2011)
Five consecutive transplantation experiments (8 weeks each) were performed in 10 sites of the city, submitted to different sources
of air pollution (industrial, vehicular), using plants collected from an unpolluted area. After exposure, trace metals were analyzed in the plant by instrumental neutron activation analysis.
Distribution maps were drawn, which demonstrate that traffic related elements such as Zn and Ba presented high concentrations in exposure sites near to heavy traffic avenues (cars, buses and trucks)
and may associated to vehicular sources (Ribeiro et al., 2012).
An example of drinking water biomonitoring:
Fränzle S, Markert B, Wünschmann S (2012)
Introduction to Environmental Engineering.
Wiley-VCH
among the numerous weakly electrical fishes, mormyrids like Mormyrops kannume (elephant fish, called so for its mouth forming a kind of proboscis) produce electric signals which are small (a few V peak at most) but repeat very frequently and stably as long as the fishes feel well.
In polluted waters, both frequency of repetition and shape of a single pulse will alter. In some drinking water supply plants this was and still is used to control water quality levels. The particularly attractive feature of this biomonitoring approach is that such electrical signals are most suited to automated digital analysis, much better than e.g. changes of color, behavior, or reaction times. Even though mormyrids do hardly, if at all (only certain species) reproduce in aquarium captivity, and hence studies based on reproduction toxicity are excluded (unlike, e.g., fellow fishes Poecilia reticulata [guppy] and Danio rerio [zebra fish]) while aquarium rearing must accordingly be considered somewhat stressful to mormyrids, the method by analyzing electric signals is considered reliable.
Parameters other reproduction toxicity which indeed can be detected with mormyrids in aquaria of course include death and neurophysiological changes, the latter being better addressed by their intrinsic electrical activity than by changes of behavior.
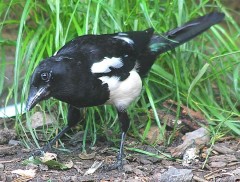
It must be pointed out, however, that, as these electrical signals are also involved in intraspecific communication including mating behavior, fishes must be kept single for water quality surveillance to avoid perturbations by this kind of communication among the fishes (there are both solitary and swarm-forming species among mormyrids and their relatives). This is a telling example of complexities involved in using animals, especially social animals, in biotests. Yet, many of the > 500 species so far employed in biotests, many are social animals with corresponding intraspecific communication avoiding perturbations of behavioral patterns, like rats or magpies (Pica pica).
Notably, there is no statement whatsoever associated to effects used in biomonitoring as to the origins (causes) of the observed effects. It may be most difficult to identify the reasons of what is happening to plants, animals or bacteria under supervision. Notwithstanding this, a biotest still provides a “directly biological” statement on possible effects of chemicals put to the environment. Accordingly, biotest and chemical analyses are kind of complementary approaches to gain pieces of information on the “state of the environment”. In biomonitoring, being a quantitative approach, both are linked by using organisms to get information otherwise to be obtained from chemical analysis. Of course, scaling must be understood for the given system (Fränzle 2010): you must know already how much lead is to be expected in leaves or fruits of some plant [-species or –cultivar XY] once a threshold level Z is surpassed in the underneath soil.
Cited references to this
chapter


